The Author Helper Suite Help – Sell-Thru/Read-Thru
Summary
We’re going to give a quick overview of the Sell-Thru/Read-Thru report, and then we’re going to dive in deep on how we calculate all this stuff. You absolutely don’t need to understand all the math, if you don’t want to go that far, but if you’re curious or if you’re the type who likes to see how things happen under the hood, this page should serve to sate your curiosity.
Please note that we will be using test data in this to show some extreme behavior that can happen in some cases. You may actually see a number of situations that arise below, so please study this carefully to ensure you understand why the report is acting the way it is.
IMPORTANT: The calculations in this report are based on KDP EBook sales and, if applicable, Kindle Unlimited Page Reads. You will need to make sure you have uploaded your KDP report for the timeframe you are selecting in order to see applicable report data.
Filtering Options
The first thing to note is that everything you filter on will impact the calculations on the report.
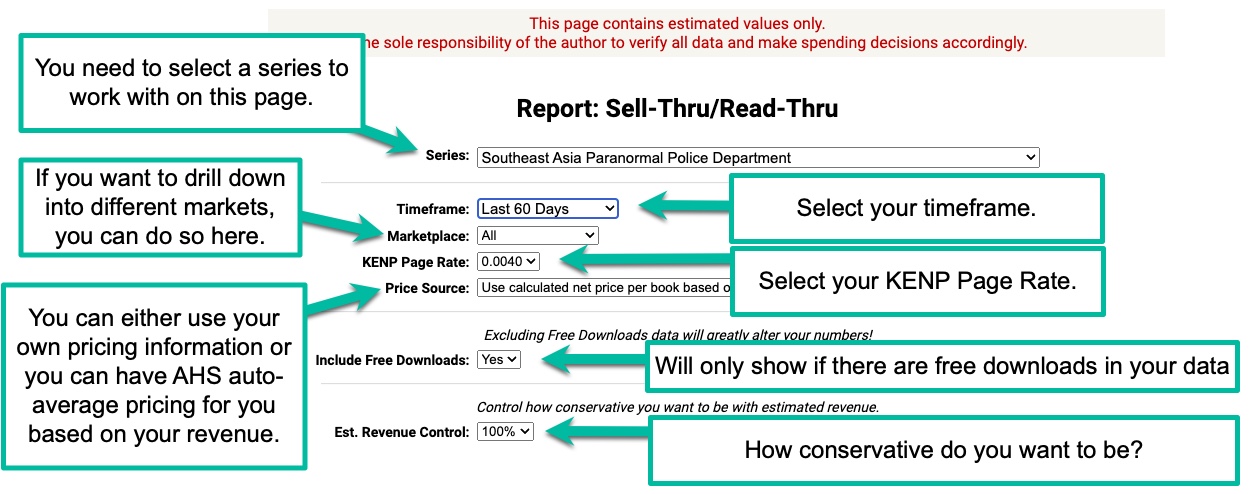
Filtering can make a great situation look bad or a bad situation look great. It’s all about perspective and your own knowledge of your books and promotions.
Here are a few examples of how things may look better/worse than they really are:
- Showing only 30 days worth of data that happened during a fantastic promotion is likely to give you inflated numbers.
- If there was a free book promotion going on during the filtered timeframe, book 1 may show 1,000 records, while book 2, which remained on sale at $4.99, only shows 10 sales. That would show you as having very low sell-thru numbers from book 1 to book 2.
- Showing only 30 days worth of data where you did no advertising or promotions at all may show lower numbers than normal, which can also skew things in your eyes since you’re studying a myopic view of the true situation.
- Showing 30 days of data during a time when you just released book 5 in the series will show inflated numbers on that book compared to the others.
It can also be a fantastic way to gauge promotional differences, for testing purposes.
Let’s pretend you’ve run multiple separate promotions of the same series, two months apart, with the following pricing strategies:
- Book 1 is free for 5 days, books 2 – 4 are at $4.99 each.
- Book 1 is free for 5 days, books 2 – 4 are at $2.99 each.
- Book 1 is free for 5 days, book 2 is at $2.99, book 3 is at $3.99, book 4 is at $4.99.
- Book 1 is $0.99, book 2 is at $1.99, book 3 is at $2.99, book 4 is at $3.99.
Since each of these promotions happened at separate times, you can use the Sell-Thru/Read-Thru report to see how each of them did and make determinations for which ones were the most effective for your business.
Knowing when things changed on your books, therefore, is key to understanding the Sell-Thru report. Everything from promotions, new ads, pricing changes, book releases, cover changes, and so on will impact your Sell-Thru/Read-Thru on any given series. It’s your job as an author to keep track of these changes so you can best understand if said changes were helpful or detrimental to the success of your series.
Please keep that in mind when looking at these reports as you will always be the only one who can bring common sense reasoning to the values seen. There is sadly no way the AHS system can know all the nuances regarding changes you may have made.
A Basic View Of How to Read This Report
This section will provide an overview that should help you quickly understand what you’re looking at.
IMPORTANT DISCLAIMER: All data in these charts provide estimated values and do not represent any direct or indirect recommendations for how an author should spend their money. It is the responsibility of each author to make their own determinations in this regard.
The main section of your report shows you how each of your books is doing within the timeframe selected.
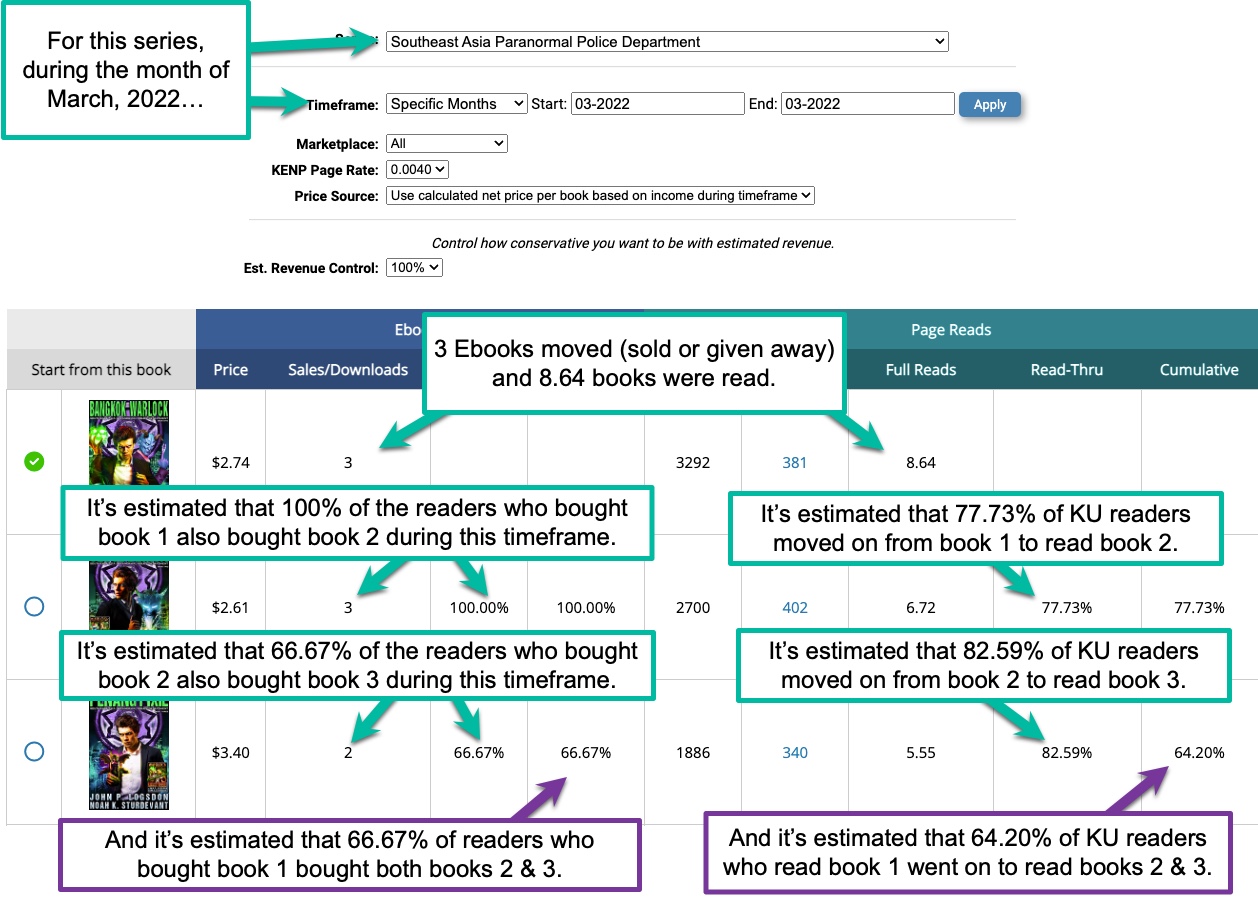
Knowing our Sell-Thru and Read-Thru from book to book can help us spot trends, see where readers may be falling off, and help us to figure out what to do to improve things. Each timeframe you select will provide additional information in that regard as well, specifically since you, being the author, should know when changes may have happened.
For example, an increase/descrease in sales could be due to:
- New pricing strategy
- Promotions
- Increased ads spend
- Changing all your book covers
- etc.
Knowing the Cumulative Sell-Thru/Read-Thru gives us a broader range of information because it provides an estimate of how many readers moved through our entire series from book 1 during the given timeframe.
If we select All Data Collected as our timeframe, we can see the full picture of both Sell-Thru/Read-Thru and Cumulative Sell-Thru/Read-Thru.
Combining this information, even at a glance, can help us see the health of our series, which will aid us in determining if more books should be written or if we should write that final wrap-up book and retire this series for one that’s doing far better. It could also tell us if we need to ramp up our ads and marketing or tamper it.
Estimated Potential Revenue And Other Useful Data
Our selected series and timeframe can also provide us with other estimates as well.
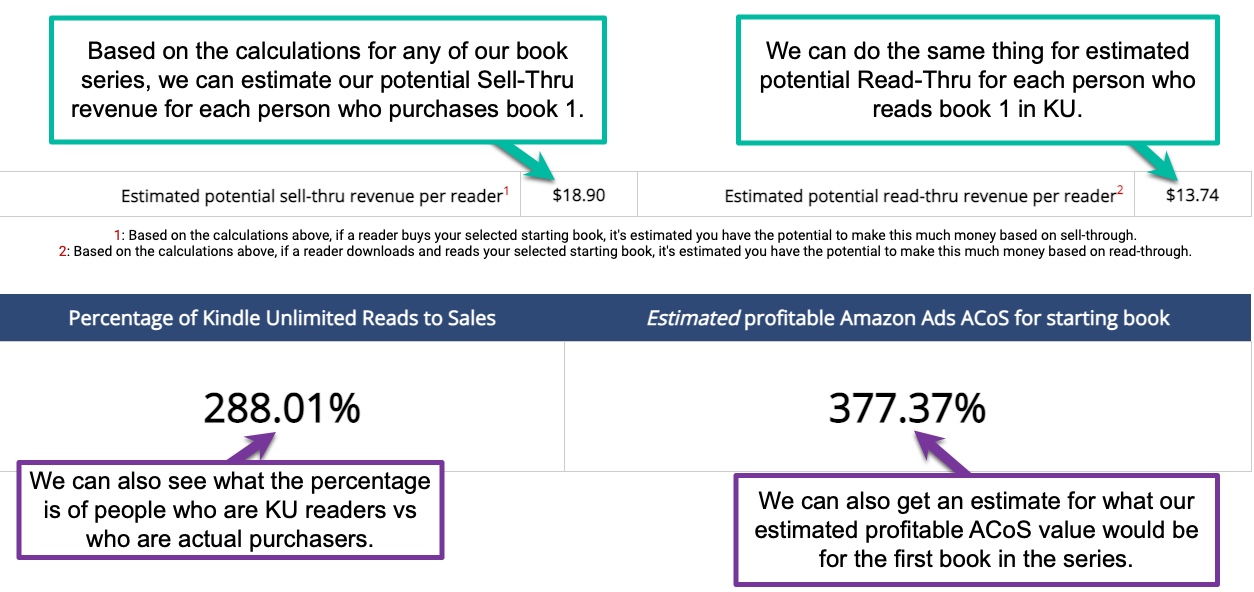
While these are purely estimated values, they give us a ballpark figure we can use to further our information base.
NOTE: It is recommended that you consider lowering the Est. Revenue Control at the top of this page. The more conservative you are, the more likely you’ll be happy with your results. It is up to each author to decide how conservative they want to be in their approach, obviously, but many authors drop their values by 50% in order to be extra careful. Other authors do some manual calculations over time to determine the best percentage to drop these estimates so they’re “close enough.” We reiterate again, however, that it is solely your responsibility as an author to make any financial determinations.

Those are the basics of what you need to know to get some quick information regarding the health of your series.
There are still a few things you need to learn, and also a few things to set up in order for the reports to function properly, so please keep reading…
Choosing a Starting Book
Changing the starting book can allow you to see a different picture based on the location in your series.
But why would you want to do this?
The simple answer is that book 1 tends to be the book that gets discounts, free giveaways, etc. That means you may see reduced numbers on our Cumulative Sell-Thru values over given timeframes while simultaneously seeing a healthy Sell-Thru from book 2 to book 3, book 3 to book 4, and so on. In other words, all that marketing advertising you need to do for book 1 is making the Cumulative look rough.
It might actually be great, though.
So we made it so you can choose where to start the calculations on the report. If you choose book 2, the Cumulative information will be calculated from book 2 through to the last book. This may help give you a more logical picture of how things are really going during those crazy promotional days where book 1 is flying off the shelves because it’s either free or having a super lower-priced sale.
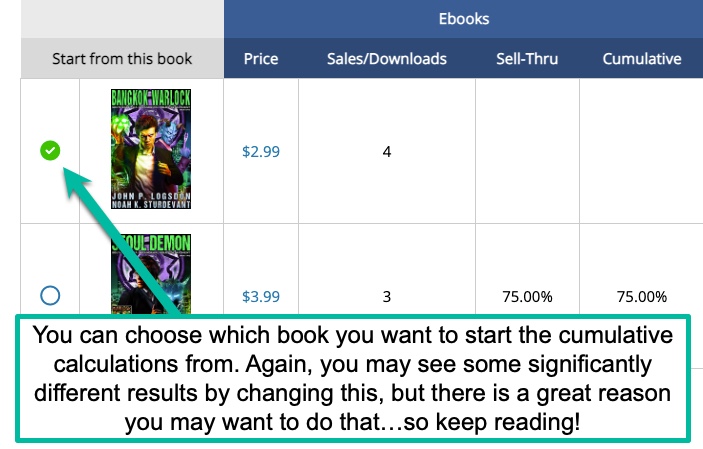
NOTE: Changing the starting book from 1 is going to show different totals, as it should, and some of these may look kind of strange. You have to keep in mind that these calculations are all based on percentages from the starting book to the final book in the series.
NOTE: After changing the start book from book 1, you may see a nice uptick which may tempt you to start advertising from book 2 forward instead. If that’s part of your normal strategy, or if you just want to test the waters, that’s great. However, we do caution you to keep in mind that starting from book 1 is the most realistic picture of how well your series is going.
Price Source & Setting your prices appropriately
Remember that any calculations listed at the bottom of the page will be based on the amounts your books were selling for at the given timeframe. If you had a big sale going on for cheap but you leave the values at their normal amounts, the estimates at the bottom of the page are going to be way off.
There are two ways to handle this:
- Allow AHS to use an average price over the timeframe given for each book.
- Use the prices you’ve set manually.
If you opt to use AHS, here’s how we will caclulate each net price that will be used in the rest of the equations:
Book Price = Total KDP Ebook Sales During Timeframe Selected / (Units Sold + Free Downloads)
Therefore, if you had $20 in sales with 10 units sold, and there were 0 Freebies given out, you’d have the following:
Book Price = 20 / (10 + 0) = $2
If you happened to have been doing a free promotion and gave away 500 Freebies, the equation would be as follows:
Book Price = 20 / (10 + 500) = 20 / 510 = $0.04
I recognize that looks like a super small number, but remember that we’re working with statistical estimations here. In order to get a decent estimate, we need to know the amount of potential revenue per reader. If we turn off those free downloads, we’ll see a much happier picture, but the accuracy is going to be way off because book 1 only had 10 sales, the rest of that 510 number were free downloads.
Why does that matter? Well, if book 2 had 120 sales during our promotion–sales, not free downloads–we can be pretty confident those 120 sales didn’t come from 10 sales of book 1. The most likely reason those 120 sales showed up on book 2 is from the added number of readers who got book 1 for free.
It’s certainly possible there are a few of those 120 sales coming in from readers who just happened to finish reading book 1 (that they bought outside of your selected timeframe), but even that number isn’t likely to hit 120.
Setting the prices manually.
If you’d prefer to set the prices yourself, you’ll need to do so for each book. Please keep in mind that every time you change the timeframe on your report, the system will continue using the prices you manually set from the last filtering. That can significantly alter the estimations!

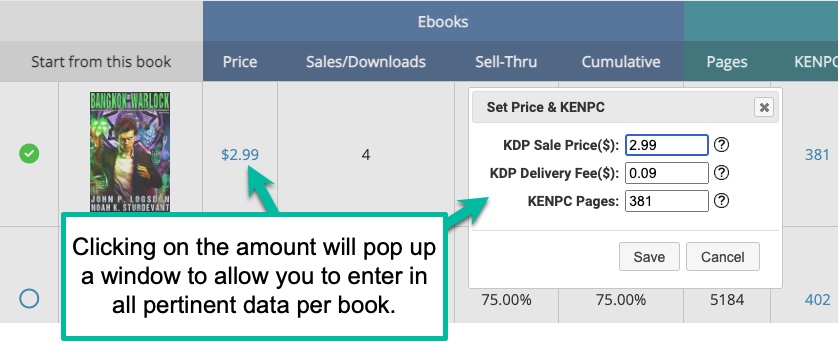
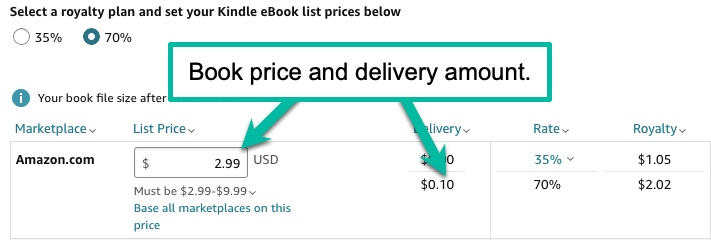
Note that for better accuracy, you should include the Amazon delivery fee as well. You can find that value on the KDP dashboard for your book, under the pricing section.
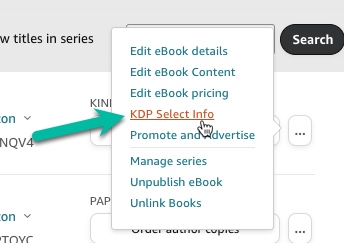
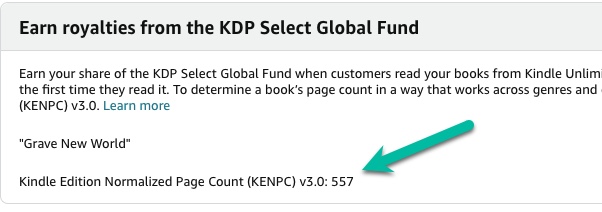
Also, if you’re on KDP Select, you will want to fill in your KENPC values. If you don’t, you won’t see any Read-Thru information. You can find this on the KDP Select page on the KDP dashboard for your book. It’s about halfway down the page.
You should have enough information to use the report now, but if you want to learn how things work under the hood, keep reading. 😉
DEEP DIVE
If you’re not interested in understanding what’s going on behind the scenes, you can skip this section completely.
How many Sales/Downloads have you got?
The Sales/Downloads column of the report is going to show a combined amount of actual sales and free downloads for any given period, assuming you have elected to include free downloads in the report.
If you elect not to include free downloads, it will only show the number of ebooks sold during the timeframe selected. Again, this is not recommended, but we give you the freedom to make those determinations on your own.

Just to reiterate, all calculations may appear drastically different based on the inclusion or omission of the free downloads items if you were running a free promotion during the timeframe selected.
Sell-Thru percentage
The Sell-Thru column is a straightforward percentage calculation from the previous book to the current book.
The calculation is as follows:
Sell-Thru Percentage = Current Book Sales & Downloads / Previous Book Sales & Downloads
So, for example:
- Book 1 has 4 sales & downloads
- Book 2 has 3 sales & downloads
Our calculation would be:
3 / 4 = 0.75, or 75%.

You’ve probably also noticed that the Cumulative percentage from book 1 to book 2 (in our example image) is the same as the Sell-Thru column. That will always be the case from the selected starting book to the next book in line since the Cumulative calculation is the same as the Sell-Thru calculation from the starting book to the next book in line.
Cumulative percentage
The Cumulative column is the same basic calculation as the Sell-Thru percentage, but with one very important distinction: all book sales/downloads are divided by the selected starting book instead of the previous book in the list.
The calculation is as follows:
Cumulative Percentage = Current Book Sales & Downloads ⁒ Selected Start Book Sales & Downloads
So, for example:
- Book 1 has 1994 sales & downloads
- Book 2 has 1291 sales & downloads
- Book 3 has 951 sales & downloads
Our Sell-Thru calculation from book 2 to book 3 would be:
951 / 1291 = 0.7366, or 73.66%.
But our Cumulative Sell-Thru calculation from book 1 through to book 3 would be:
951 / 1994 = 0.4769, or 47.69%
That’s because we are going to be dividing the sales & downloads of book 3 by the starting book, which in this case is book 1.
Refer to the following image to see this in action graphically.

This is why selecting a different start book in your calculations can provide such different results, especially when it comes to cumulative percentages and estimated revenue.
For an example of this, compare the following image to the one above so you can see what happens when we change the starting book from book 1 to book 2.

So what would happen if I chose a completely different timeframe, one where I had a giveaway going on book 1 while selling book 2 at its normal price?
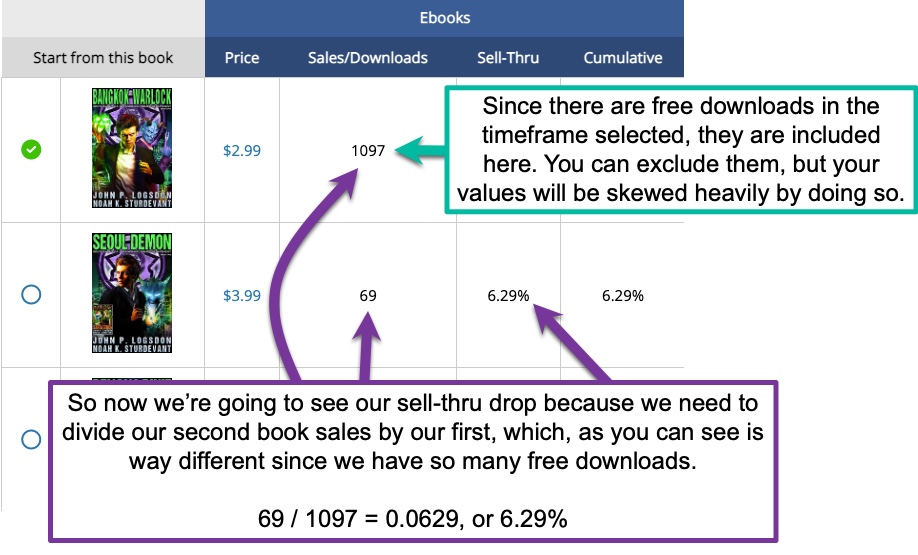
…and how would that impact our Cumulative percentages?
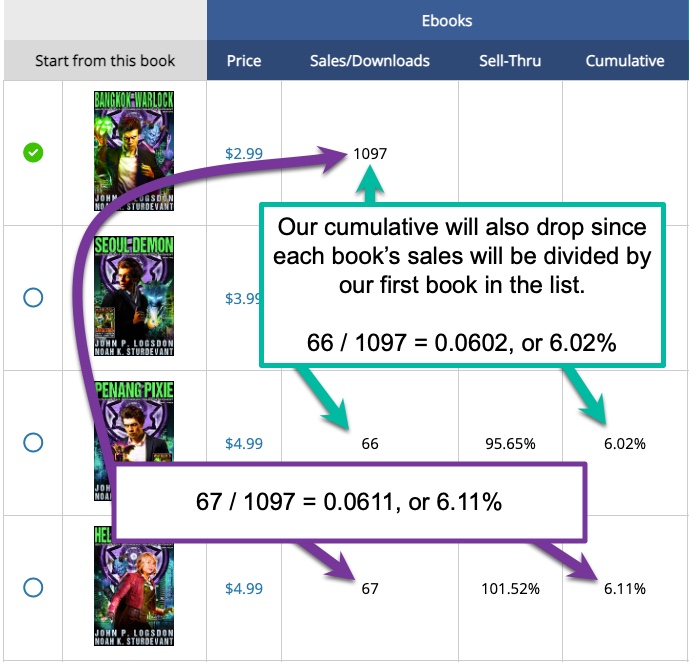
If you compare the last two images above with the one above that, you’ll see what a major difference our numbers can provide just by selecting a different timeframe, and also by including those free downloads, assuming there are free downloads during the selected filter.
But what if we kept that same timeframe in our filtering and decided not to include our free downloads in the calculation?
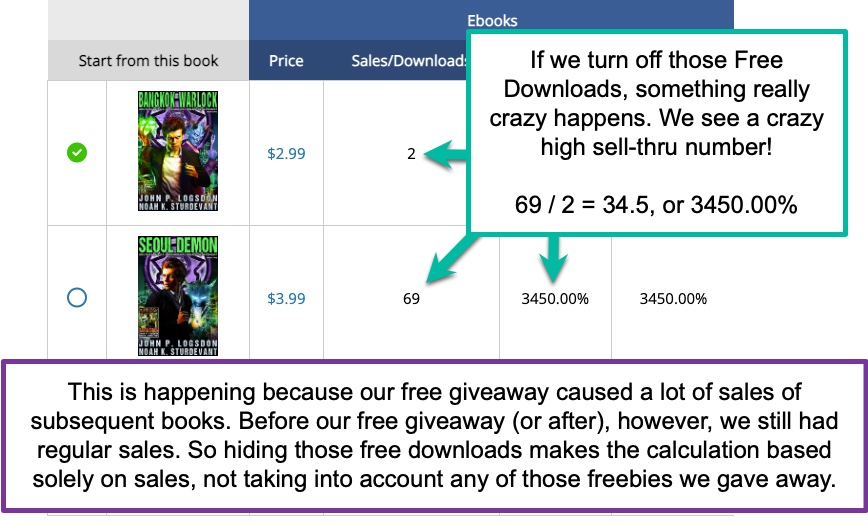
More importantly, we know that some of those sales on book 2 came from the free downloads on book 1. It’s obvious that must be the case, especially if we know our normal sales during a particular timeframe is much lower than we’re seeing here, not to mention the fact that selling 2 copies of book 1 isn’t likely going to result in our selling 69 copies of book 2!
Unfortunately, there is no way for the AHS system to differentiate which of those book 2 sales came from the free books and which ones came from previous sales.
That’s where we have to make some judgments about what we’re seeing.
We could quickly recognize that a decent number of those book 2 sales came from the free downloads. Additionally, we’d want to keep an eye on this for another few months to see if those book 2 sales start ramping up, even if book 1 sales (back at its normal price) don’t ramp up accordingly.
Actually, that would be a very good indicator to tell us that our free downloads are converting to Sell-Thru, making those free downloads worthwhile.
Conversely, if we don’t see much of a ramp up in sales on book 2 over the next couple of month, we’ve learned an even more important lesson: giving away books typically end up unread and unloved in a sea of free books on a reader’s Kindle, making the giveaway process (at least for the particular series in question) not as beneficial as we might’ve hoped.
Total estimated sell-thru revenue
While AHS cannot guarantee 100% accuracy here, we’re making a pretty decent educated guess…but that’s all it is.
And please do keep in mind that when you change filters, include/exclude free downloads, select a different starting book, tweak prices, etc., these values are going to change as well. This is because every nuance will cause different values to be entered into the equations. The math remains the same, but the values entered in have changed, thus resulting in different estimates out the other side.
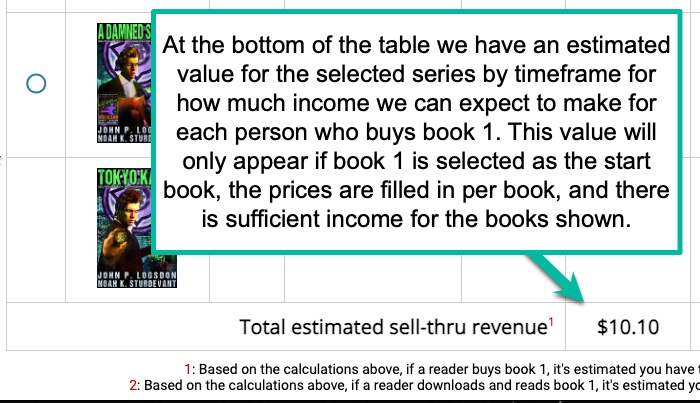
So how are we coming up with this estimate?
Let’s look at the math! (I know. Sorry.)
Step 1 – Calculating what we get from Amazon
The first thing we do is make sure we have the book’s sale prices and such in place, as we’ll need that information to do our calculations.
If you’ve elected to enter your sales prices manually, the estimated amounts will be based on whatever values you put in there, not off any actual downloaded income amounts shared with us by KDP, so your estimates will only be as useful as the sales prices you enter for each item.
Also, these amounts are based on Amazon’s algorithms, meaning the percentages we use will be the ones provided by Amazon/KDP.
Anything less than $2.99 or greater than $9.99 results in a 35% amount to the author, with no delivery deduction rate. According to KDP, the 35% payout rate is exempt on the delivery deduction. Now, anything between $2.99 and $9.99 (inclusive) results in a 70% payout to the author, after first deducting the delivery rate.
Note: Some folks subtract the delivery rate after multiplying the sales price by 70%, but according to KDP, the delivery rate is deducted prior to the 70% multiplication.
Here are two sample calculations to show this in action:
- Book Price: $0.99
- Payout percentage: 35%
Leaving us with $0.99 * 0.35 = $0.35
…and for the 70% books:
- Book Price: $4.99
- Delivery fee: $0.08
- Payout percentage: 70%
($4.99 – $0.08) * 70 = $3.44
Here’s a chart to show how that might look for 3 books.
| Book | Gross Price | Delivery Cost | Percentage | Price |
| 1 | $0.99 | $0 | 35% | $0.35 |
| 2 | $4.99 | $0.08 | 70% | $3.44 |
| 3 | $6.99 | $0.12 | 70% | $4.81 |
If you’ve elected to allow AHS to calculate your price-per-user value, the price will be averaged by units sold + free downloads.
Price = Total KDP Ebook Sales During Timeframe Selected ⁒ (Units Sold + Free Downloads)
Step 2 – Calculating our estimated sales based on Cumulative Sell-Thru
The next thing we do is simply take the author net and multiply that by the Cumulative Sell-Thru amount for each book.
So, keeping with our 3 books, let’s create a quick chart showing Sell-Thru and Cumulative.
| Book | Sales/Downloads | Sell-Thru | Cumulative |
| 1 | 10 | ||
| 2 | 7 | 70% | 70% |
| 3 | 6 | 86% | 60% |
Now we’ll take the Price amounts from above and tally things up, using another chart to hopefully make it easier to read:
| Book | Price | Cumulative | Total |
| 1 | $0.35 | 0% | $0.35 |
| 2 | $3.44 | 70% | $2.41 |
| 3 | $4.81 | 60% | $2.89 |
Next, we sum those totals to get our estimated sales for each person who purchases book 1 in our series:
$0.35 + $2.41 + $2.89 = $5.65
In a nutshell, we’re estimating that for each person who purchases book 1 in our 3-book series, based on our prices and timeframe, we have the potential to make $5.65.
What happens if our Cumulative amount shows a value greater than 100%, though?
Yes, there are times where that can happen, and it’s pretty common. An example would be that we’re looking at a 30 day period where we see book 2 having 10 sales and book 1 only has 5. That’d be a 200% Cumulative.
How? It’s all about the timeframe selected.
For example, this month we’ve sold only 5 copies of book 1, but last month we sold 10 copies. The people from last month’s sales are just now finishing reading book 1 and have elected to buy book 2 this month.
That’s going to make our Cumulative jump up.
So what do we do in this situation? We rationalize that a single person can only purchase 1 copy of each of our books. Okay, technically, they could purchase more than that if they really wanted to, but we’re going to make the assumption that’s a very rare occurrence. Therefore, we’re going to base our estimated revenue based on a maximum Cumulative of 100%, even if we’re seeing a value greater than that on our chart. Otherwise, we’re going to show numbers that simply aren’t realistic.
AHS will automatically recognize that 100% is the maximum amount of spend per reader and not allow the calculations to exceed that value.
Step 3 – Using this information
While this is only an estimate, it can help us to make decisions regarding our ad and marketing spends because we have a value to put up against how much we’re risking.
How much are we willing to spend on a CPC (Cost-Per-Click) on our ads, knowing that we average 1 sale every 10 clicks? If our estimated potential revenue shows we’re expected to make around $10 for each reader who buys book 1, and our CPC is $0.20, that means we’ll need to spend roughly $2 to make $10. That’s an $8 profit, which would tell me I can manage a pretty high CPC and still be profitable. At 1 sale every 10 clicks, even $0.50 per click would net me roughly $5. That’s doubling my money!
You can do the same thing with promotional spends. If a promotion runs $100, you can determine how many copies of book 1 need to sell during that promotion for you to be profitable. Again, if we make an estimated $10 for every reader who buys book 1, we’d need 10 people to buy book 1 in that promotion to break even. Everything over that is profit.
Knowing the potential of each series allows us to make informed decisions about how much we should invest, but it also can show us where drop offs happen, and can even tell us if we should continue writing in that series or jump to a different series entirely. It can also help us to decide if we should invest more in ads and marketing for the series, or if we should lower our spends here and focus them on another series, instead.
When free books are included and there are a lot of them…
What if I have a juicy number of free downloads during a timeframe, my estimated values are tiny! What gives?
Ah the joys of stats!
Let’s look at that situation…
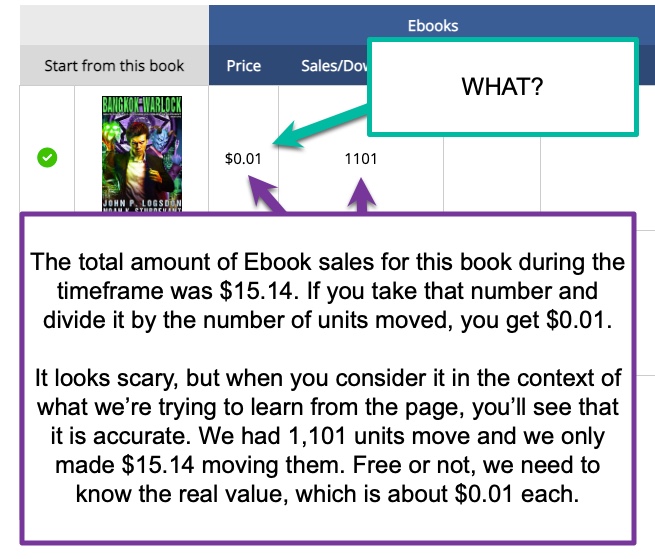
I know, I know. That looks crazy. But you need to compare apples to apples here or your numbers are going to be completely wrong.
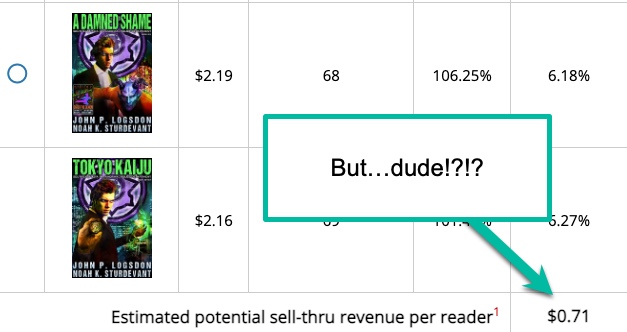
Don’t freak out yet. Let’s jump through the hoops and see what’s happening.
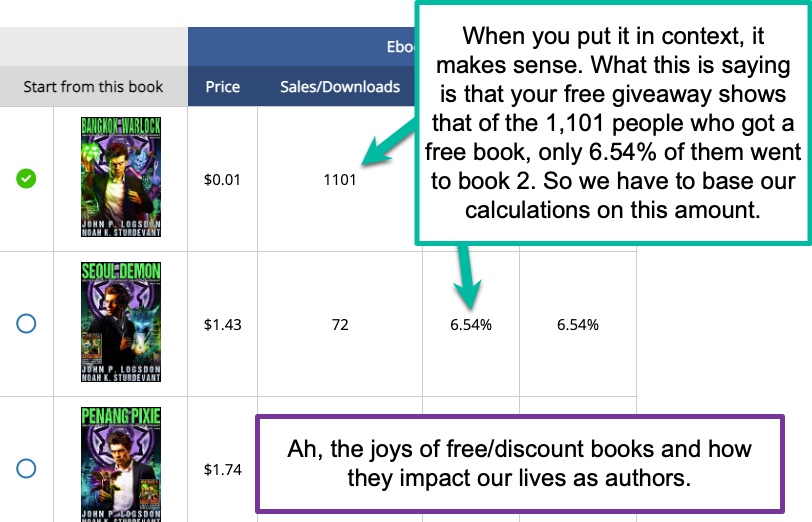
See, no matter how much we want that number to be higher, it’s not because we’re only seeing 6.54% of everyone who picked up book 1 (sales and free combined) have moved on to book 2.
That’s a very small conversion rate.
And that $0.71 at the bottom is based on that rate. It has to be because we’re starting from book one.
But there’s something we can do to look at how much we’re making for each of those 6.54%.
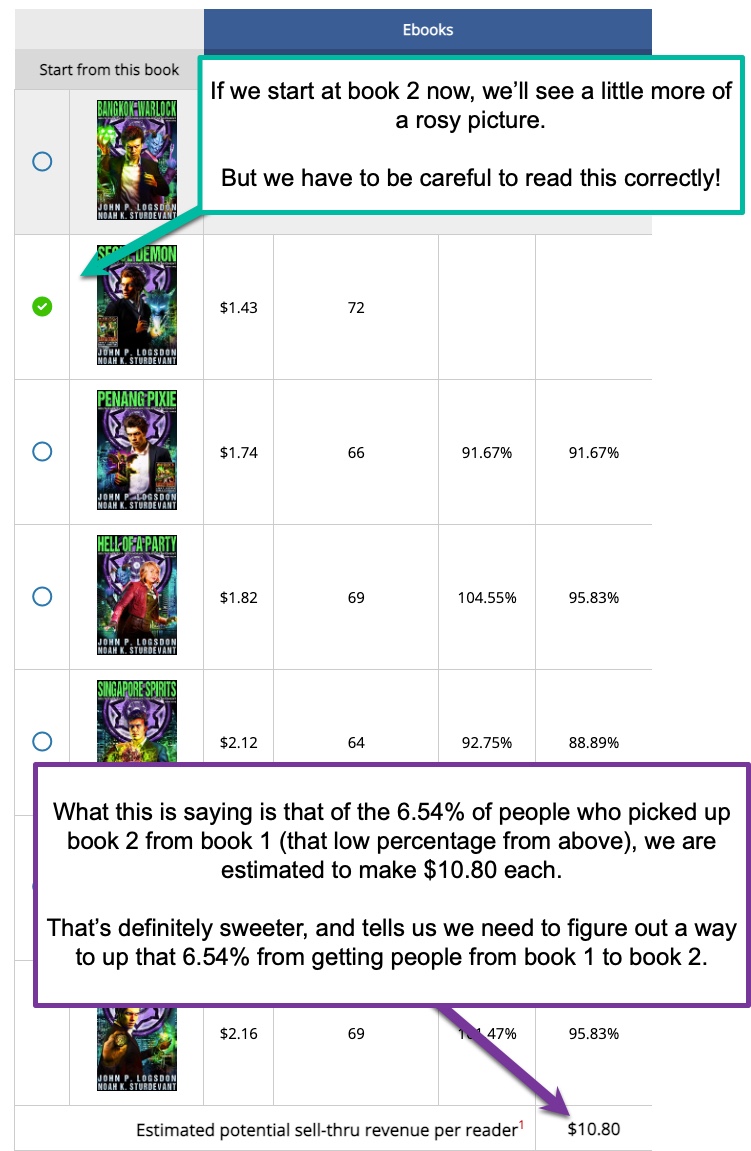
By selecting book 2 as our starting book in the calculation, we’re able to see what those 6.54% of people who did go from book 1 to book 2 have brought in…each.
Since 72 (the units moved for book 2) is 6.54% of 1,101 (the units moved for book 1), we can multiply the $10.80 by 72 and see we have made an estimated $777.60 actual dollars on this promotion.
Note: It’d be smarter to just go to the home page and select this series on the timeframe to get an accurate amount of what your net was for the promotion (assuming you entered in the cost of the promotion and such), but you can flip out your calculator and do the same general thing here.
If your promotion cost you $100, I’d say an estimated $677.60 profit is nothing to sneeze at!
Again, though, the overall picture tells us that we need to figure out a way to increase that 6.54% value! But then, don’t we always?
Calculating Read-Thru and Cumulative Read-Thru
The good news here is that our calculations are the same ones we use for Sell-Thru and Cumulative Sell-Thru, except for one very important difference: We have to get the page reads revenue per book in a different way.
For Sell-Thru, we either enter in the amount ourselves or we allow AHS to calculate the amount per sale based on the data AHS has for sales.
To get the Read-Thru, however, we’ll need to enter in our KENPC value and allow AHS to calculate an estimated revenue for the books based on the number of pages read multiplied by some page rate. Since that page rate may vary greatly, depending on what Amazon’s up to at any given time, we allow you to select a page rate from 0.003 up to 0.005. This seems to be within the range of what we’ve all seen with Amazon.
The equation is as follows:
Page Reads Revenue Per Book = Pages Read * Page Rate
Let’s pretend we have selected 0.004 as our page rate (that’s the system default) and we have a book that has 2485 page reads. Our equation would look like this:
Page Reads Revenue Per Book = 2485 * 0.004 = $9.94
If we up that page rate to 0.0045, we’d have:
Page Reads Revenue Per Book = 2485 * 0.0045 = $11.18
The best methodolgy is to go with a page rate you feel is a little on conservative side. There’s no point in inflating your own numbers only to find out you’ve actually been making less.
If you want to look at previous months page rates to see how they compare, you can check out the AHS KENP Page Rate Tool.
Aside from that, we follow the same process for generating our Read-Thru from book-to-book as we do with Sell-Thru, and the same with Cumulative Read-Thru as well.
Calculating Potential Read-Thru Revenue
Getting the Read-Thru revenue is pretty straightforward. We simply take the total number of pages read for the timeframe selected, multiply that by the page rate of your choice, and divide that by the number of full reads on the first book.
Potential Read Thru Revenue = (Pages Read * Page Rate) / Book 1 Full Reads
Let’s pretend we have selected 0.004 as our page rate (that’s the system default) and we have 3 books with the following pages read:
Book 1: 1,200
Book 2: 2,200
Book 3: 3,300
We also know the KENPC pages for book 1 to be 250, meaning we have 4.8 full reads (1200 / 250 = 4.8).
Potential Read Thru Revenue = ((1200 + 2200 + 3300) * 0.004) / 4.8 = (6700 * 0.004) / 4.8 = 26.8 / 4.8 = $5.58
This value would be impacted by the revenue control, if you’ve changed it, of course.
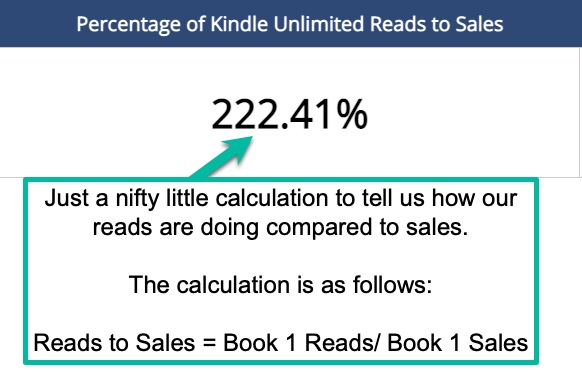
Percentage of Kindle Unlimited Reads to Sales
Nothing fancy going on here. We simply had a number of authors who asked if we would provide a Reads to Sales calculation for them.
Reads to Sales = Book 1 Reads/Book 1 Sales
Estimated profitable ACoS for Amazon Ads for the starting book
Please note this value is not for the entire series, but rather the first book (or the book you selected as the starting book in the report) of the series.
It does require that we know the full values for the entire series, however, because we’re basically saying, “What does my ACoS for ads on the first book in the series have to be less than in order for me to be profitable on the entire series?”
Amazon calculates its ACoS using the following formula:
ACoS = Ad Spend / Gross Sales
Again, what we’re setting out to do is to find what an author’s ACoS should be for Book 1 to break even on all sales from the series. This is so that an author can compare The Author Helper Suite’s ACoS figure with the ACoS number from Amazon’s ad page—if The Author Helper Suite’s ACoS target figure is equivalent to, or less than, the actual reported ACoS figure on Amazon’s ad page, then the author should be breaking even or turning a net profit.
To do this, we’ll assume that all of our Ad Spend is being allocated to Book 1 only; that is, the Ad Spend for Book 1 is equivalent to the Ad Spend on the entire series. Our goal is to make sure that the ACoS for the entire series is equivalent to, or less than, 100%, as any number greater than that would represent a loss.
We thus have the following equation:
Series ACoS = (Ad Spend / Gross Series Sales) = 100%
By rearrangement, we have:
Ad Spend = Gross Series Sales
This makes sense, because effectively we’re trying to spend no more than we take in.
For Book 1 we have the comparable equation:
Ebook 1 ACoS = (Ad Spend / Gross Ebook 1 Sales) = (Gross Series Sales / Gross Ebook 1 Sales)
This is easy to calculate, as we have access to both the gross series sales and the gross book 1 sales.
Example. Let’s say that Book 1 grossed $20, and the series grossed $100. Then we can estimate the break-even ACoS for Book 1 as:
Ebook 1 ACoS = (Gross Series Sales / Gross Ebook 1 Sales) = ($100 / $20) = 500%
With Page Reads. We can also incorporate page reads into this model, assuming that the same $ Spend quantity results in an additional number of page reads. In this case, we’d have the lengthier but comparable equation:
EBook 1 ACoS Total = (Gross Series Sales + Gross Series Pages) / (Gross Ebook 1 Sales + Gross Ebook 1 Pages)

Note the values used to calculate these estimates will be based on the price source you select at the top of the report as well.
If you choose the manually entered prices, the system will calculate the amounts based on whatever you entered, even if the prices changed in the middle of the timeframe you selected for the report.
If you select to use the AHS-calculated values, the system will use an averaged amount per book (instead of gross sales!).
Special Thanks!
We want to give a huge shoutout to the following people for their help with this report:
- Audrey Logsdon for reviewing and updating all the math in this report, as well as running simulations on various datasets to aid with accuracy.
- Bonnie Paulson from Finding Your Indie, home of tips, tools, services, and more for authors!
- Felicia Beasley from Procyon Enterprises, LLC, home of Level Up Author Marketing.
- Mal Cooper, author of the Help! I’m an Author series.


