The Author Helper Suite Help – Ads Analysis Tab
To effectively advertise your books, looking at your data is a must.
But what data? And what does it even mean? And how does it help improve ad effectiveness? Don’t worry, we’ll be answering those questions and showing how to read the data to make analysis as easy as chocolate chip cookies.
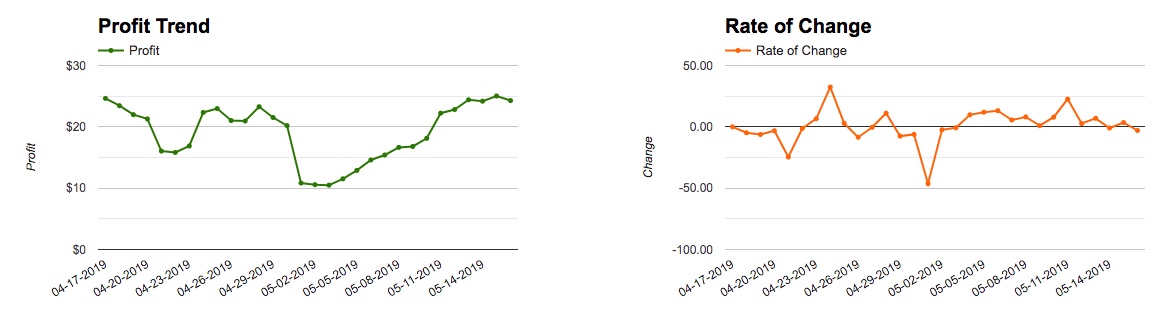
There are two charts on the page that give you a quick glance of your date. The first one provides profit trend for this series and the second gives you a rate of change (refer to this page for information on Rate of Change and why it’s important) .
There are also two data tables on the page that break things down in detail. The bottom chart—called Source Data—is pulled from the reports you upload to The Author Helper Suite and the information you input in the book details page. You’ll notice that if you don’t have data for a particular ad service, the system will note that.
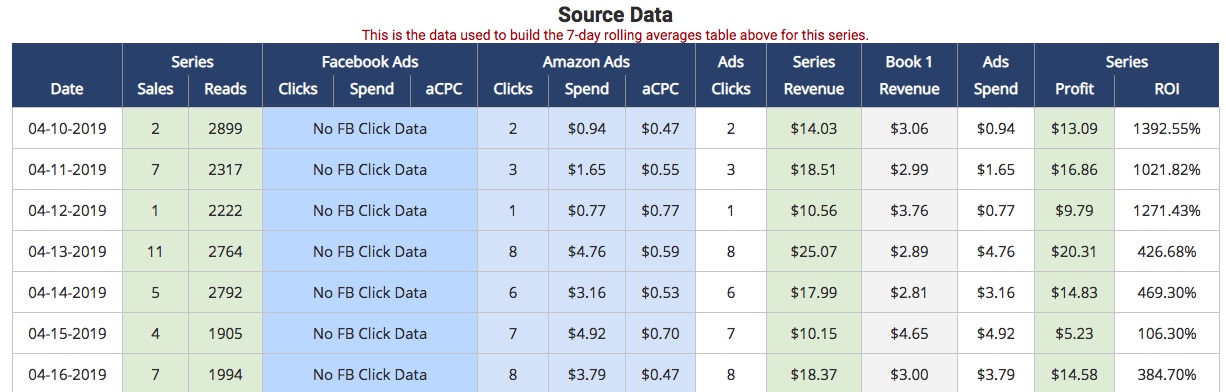
These are the numbers used to calculate the values in the top chart called Ads Analysis chart.
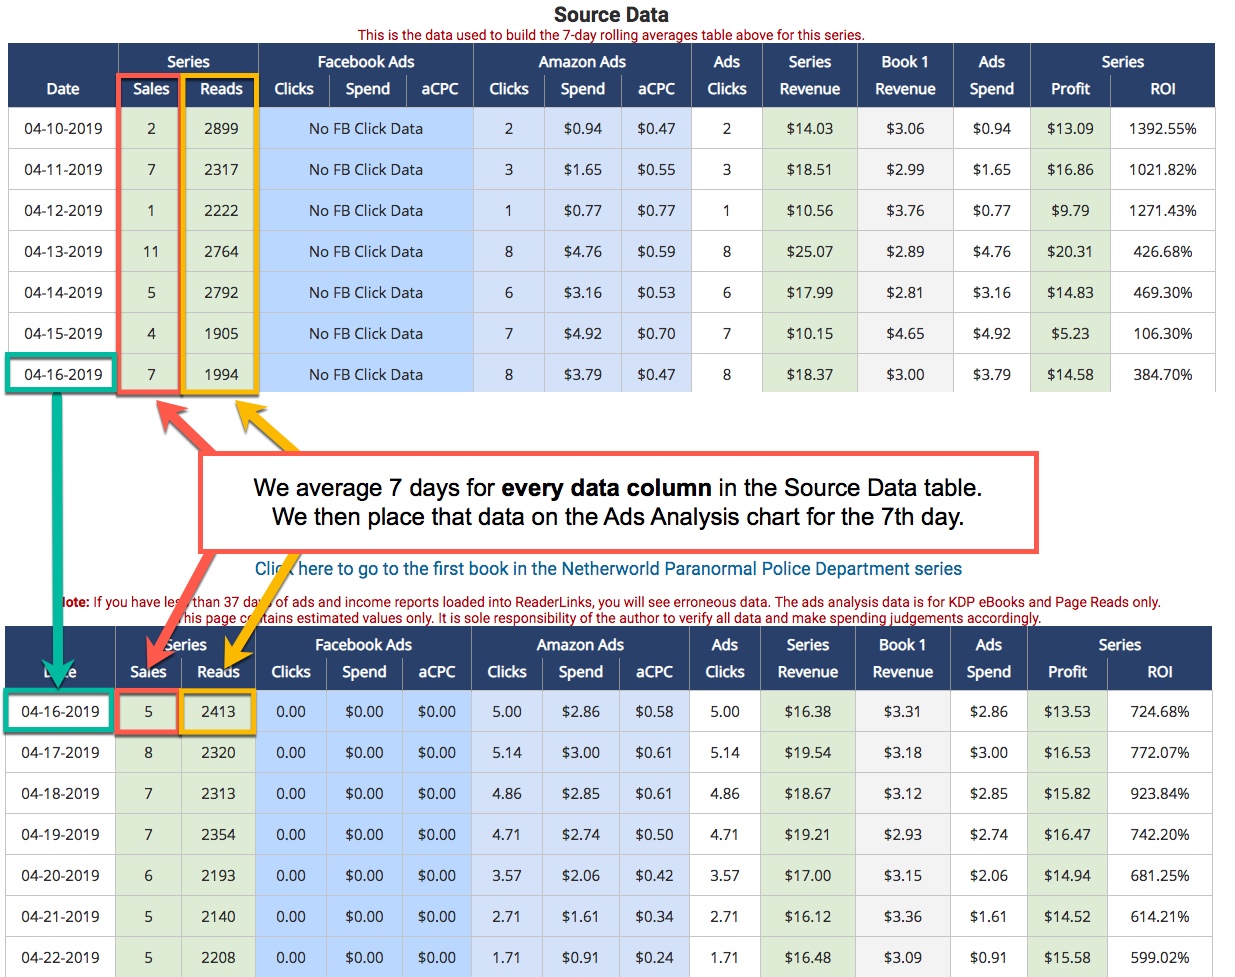
The ads analysis chart shows the 7-day running average on a daily basis for 30 days.
Sounds cool, right? But what does that mean? And why can’t we just look at the daily data?
If you’ve been selling books for any length of time—and especially if you’ve been advertising them—you know that daily numbers can fluctuate, sometimes a lot.
Just looking at the daily data makes it harder to see trends. It can also make it harder to see problems until it’s too late, or at least really costly.
A 7-day rolling average takes that day’s numbers and adds them to the previous 6 days numbers to get the total number of sales/page reads/any other data you need over the 7-day period. To find the average daily number, though, divide by 7.
But just a one-day average can only tell you so much.
The ad analysis chart covers all those averages for 30 days up to yesterday’s date. Since the current day isn’t over yet, we don’t consider that data.
This is why it’s called a rolling average.
Later, we’ll discuss what fun things we can do with this data, but first, we’ll look at each column to see what they mean.
NOTE: If you have less than 37 days of data entered for any given series or book, your averaged data will be incomplete.
CHART COLUMNS
Sales/Reads: By looking at the sales and reads columns for the series (or book if you’re on the book page), you can see how your sales and reads are trending day to day.
Trending upward? That’s good.
Consistent numbers day to day? Not bad.
Trending downward? Uh oh. Time to investigate… later.
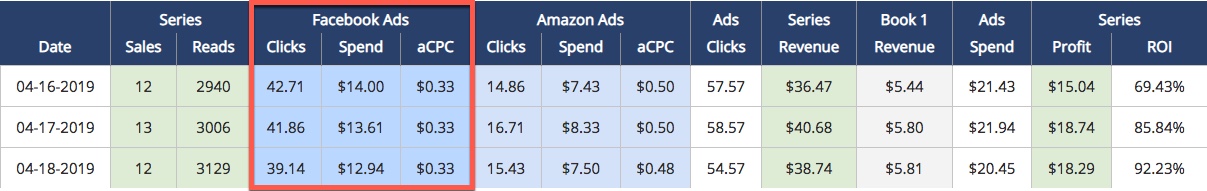
Facebook Ads: This section will tell you your average clicks, spend, and your average Cost Per Click for Facebook ads.
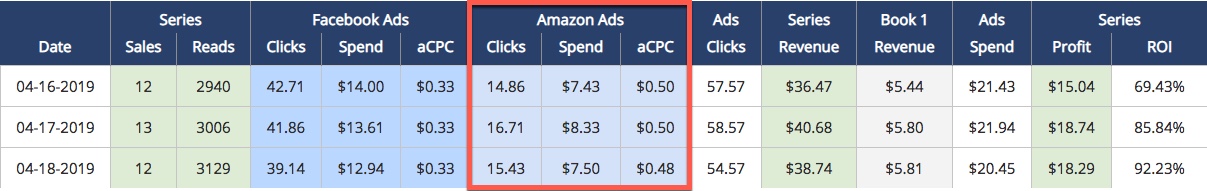
Amazon Ads: This section will tell you your average clicks, spend, and your average Cost Per Click for Amazon ads.
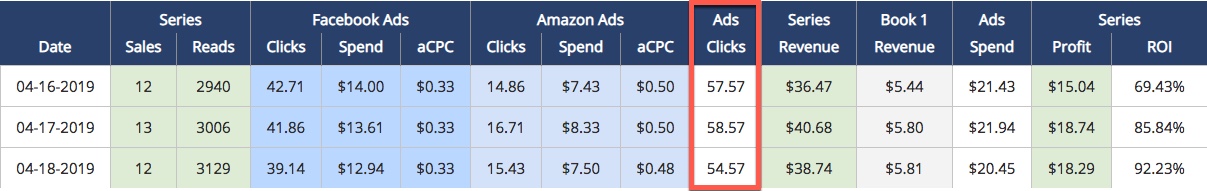
Ads Clicks: This column adds both the average Facebook ads and Amazon ads clicks to give you the 7-day rolling average ad clicks.
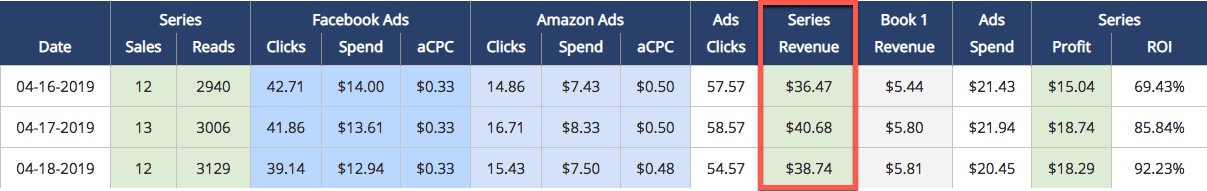
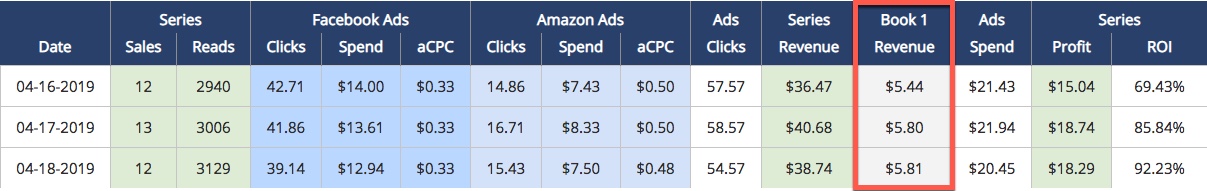
Series Revenue: This is the average revenue over 7 days of the series as a whole.
Book 1 Revenue: This column is the average revenue over 7 days for book 1. We look at book 1 because that tends to be the book we focus ads on.
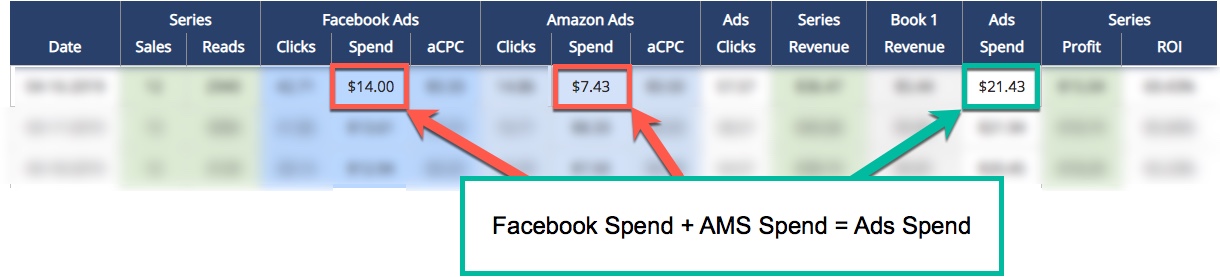
Ads Spend: Just as with your ads click data, we combine the Facebook and Amazon ads spends to tally up the full (averaged) ads spend for the day. This will be used to help us determine our profit for that day.
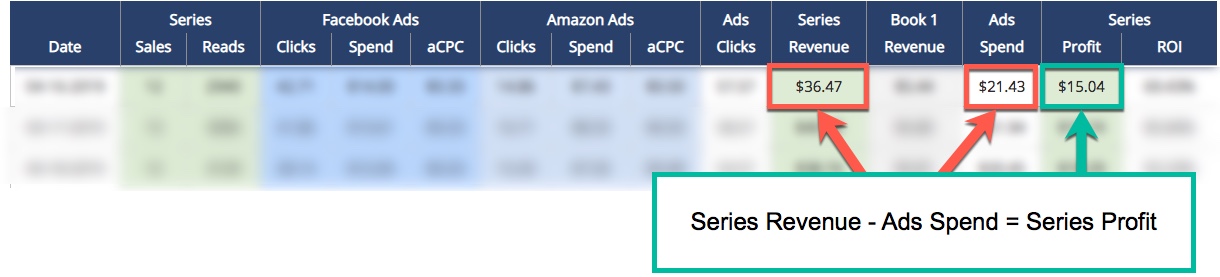
Series Profit and ROI: The last section shows the average profit over 7 days and the Return On Investment (ROI) percentage.
Profit is calculated by subtracting ad spend from revenue.
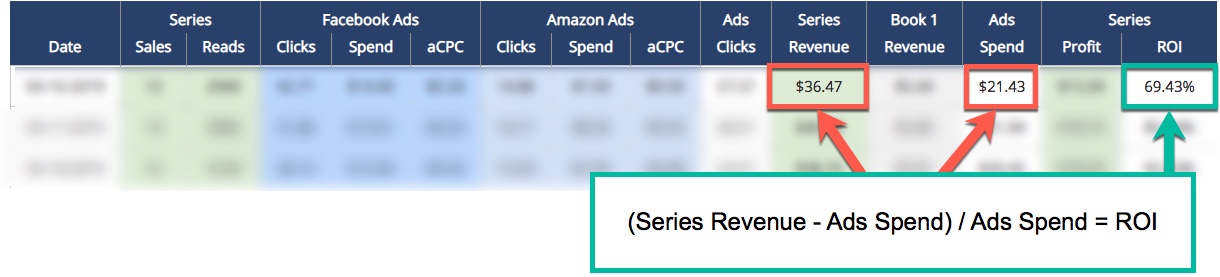
ROI is calculated by dividing your profit by your ad spend.
High numbers are good. Low numbers indicate a problem…usually.
What This Means
Knowing your average sales, page reads, revenue, and so forth is cool but it’s the relationship between the various averages that give us the ability to monitor, analyze, and troubleshoot your advertising as a whole.
NOTE: This is not on an ad by ad basis. While you can compare Facebook ads to Amazon ads, if you’re running more than one ad on either or both platforms, this reflects the total. Digging deeper at an ad level takes additional data analysis that isn’t covered here.
But the first step is always looking at the big picture and then narrowing the focus.
Relationships Between Averages
The ad analysis chart gives you a lot of numbers at once, and that can be overwhelming. Where do you start?
Series profit and ROI are closely linked. Profit shows the relationship between revenue and ad spend while ROI shows the relationship between profit and ad spend.
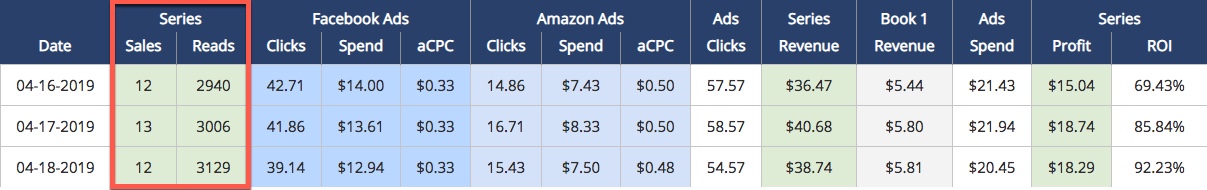
The profit column is highlighted green with ROI next to it. A quick glance down this column will show you whether your ads are making you more money, less money, or the same over the 7-day period.
We look at profit over revenue because revenue only tells us part of the story. If revenue is fluctuating, is it because ads are less effective or more? It’s hard to say without looking at ad spend and its relationship to revenue.
Next, we look at ROI, which is the relationship between ad spend and profit. Consistent average profit and ROI over time can indicate a stability with your advertising and marketing. Any fluctuations can indicate change of some sort. What change is what we look for next.
Next, we look at the relationship of book 1’s revenue to series revenue. Compare the trends between book 1 and series. If book 1’s revenue trends down, that affects future series revenue. If book 1’s revenue stays the same or trends up, the effect of that on future series revenue can demonstrate an issue with sell-thru and/or read-thru.
When book 1’s revenue trends up or down, comparing the trend of ad spend can give you an idea on why book 1’s revenue is trending up or down. And that’s the goal with this. Ask why something is different and use the data to narrow it down to find the most likely explanation. Then work to solve it—or capitalize on it.
When To Use The Chart
The chart can be used as a check-up. How are the numbers trending? If everything is pretty consistent, that’s a good sign that there have been no changes affecting your ads.
Inconsistent trends with no ad changes can indicate we need to take a deeper look.
The chart can also be used when there’s a fluctuation in daily revenue for a book or series. Sometimes we have bad sales days. Sometimes we have bad ad days. And sometimes Amazon’s reporting is delayed. A 7-day rolling average gives a better idea if there is something that needs to be investigated. One of my favorite ways—and what I find the most time reducing—is tracking ad changes made. After making a change or changes on your ad(s)—record what you changed and the data as well—you can look at the rolling average when analyzing whether the change had a positive effect or negative. NOTE: Keep in mind you need to allow time to pass between the change and analysis. I recommend at least 8 days, preferably 14 to 21. I wouldn’t go longer than 21 days though unless you manually calculate your rolling averages.
Because it’s a 7-day rolling average, the effect of the change won’t be as noticeable until at least 7 days after the change is made. Another option is to take a screenshot of your 30-day rolling average when you make the change and then compare that to the current 30 day rolling average to get a better picture on the effect of the change(s).
Special Thanks!
Felicia Beasley, from Procyon Enterprises, LLC (home of Level Up Author Marketing), was instrumental in helping us to build this tool. She also wrote the majority of this help document!
Joe Solari, from Indie Marketing Mastery, helped getting the Rate of Change chart included into this section.